I have to admit — the first time I set up a Linux server with no monitoring, no alerts, and no visibility into what was happening under the hood, I felt like I was flying blind. One day the disk was full, the next day a container had been silently restarting for six hours. Once I wired up Prometheus and Grafana, I never looked back. Here’s how to do it.
Self-Hosted Monitoring with Prometheus and Grafana
This guide walks you through standing up a complete metrics stack on a Linux host using Docker Compose: Prometheus collects metrics, Node Exporter exposes host stats, and Grafana visualises everything in a dashboard you can check from anywhere.
Prerequisites
- A Linux server (Debian/Ubuntu or similar) with Docker and Docker Compose installed.
- A domain or IP you can reach from your browser.
- 10 minutes and a cup of coffee.
The Compose Stack
Create a directory /opt/monitoring/ and save this as docker-compose.yml:
services:
  prometheus:
    image: prom/prometheus:latest
    volumes:
      - ./prometheus.yml:/etc/prometheus/prometheus.yml:ro
      - prometheus_data:/prometheus
    command:
      - '--config.file=/etc/prometheus/prometheus.yml'
      - '--storage.tsdb.retention.time=30d'
    ports:
      - "127.0.0.1:9090:9090"
    restart: unless-stopped

  node-exporter:
    image: prom/node-exporter:latest
    volumes:
      - /proc:/host/proc:ro
      - /sys:/host/sys:ro
      - /:/rootfs:ro
    command:
      - '--path.procfs=/host/proc'
      - '--path.sysfs=/host/sys'
    ports:
      - "127.0.0.1:9100:9100"
    restart: unless-stopped

  grafana:
    image: grafana/grafana:latest
    volumes:
      - grafana_data:/var/lib/grafana
    environment:
      - GF_SECURITY_ADMIN_PASSWORD=changeme
    ports:
      - "3000:3000"
    restart: unless-stopped

volumes:
  prometheus_data:
grafana_data:Prometheus Config
Save this as /opt/monitoring/prometheus.yml — it tells Prometheus to scrape itself and the host node exporter:
global:
  scrape_interval: 15s

scrape_configs:
  - job_name: 'prometheus'
    static_configs:
      - targets: ['localhost:9090']

  - job_name: 'node'
    static_configs:
- targets: ['node-exporter:9100']Bring It Up
1. Start the stack
cd /opt/monitoring
docker compose up -d2. Open Grafana
Visit http://your-server-ip:3000. Log in with admin / changeme (change this in the compose env).
3. Add Prometheus as a data source
In Grafana: Connections → Data Sources → Add → Prometheus. Set the URL to http://prometheus:9090 and click Save & Test.
4. Import the Node Exporter dashboard
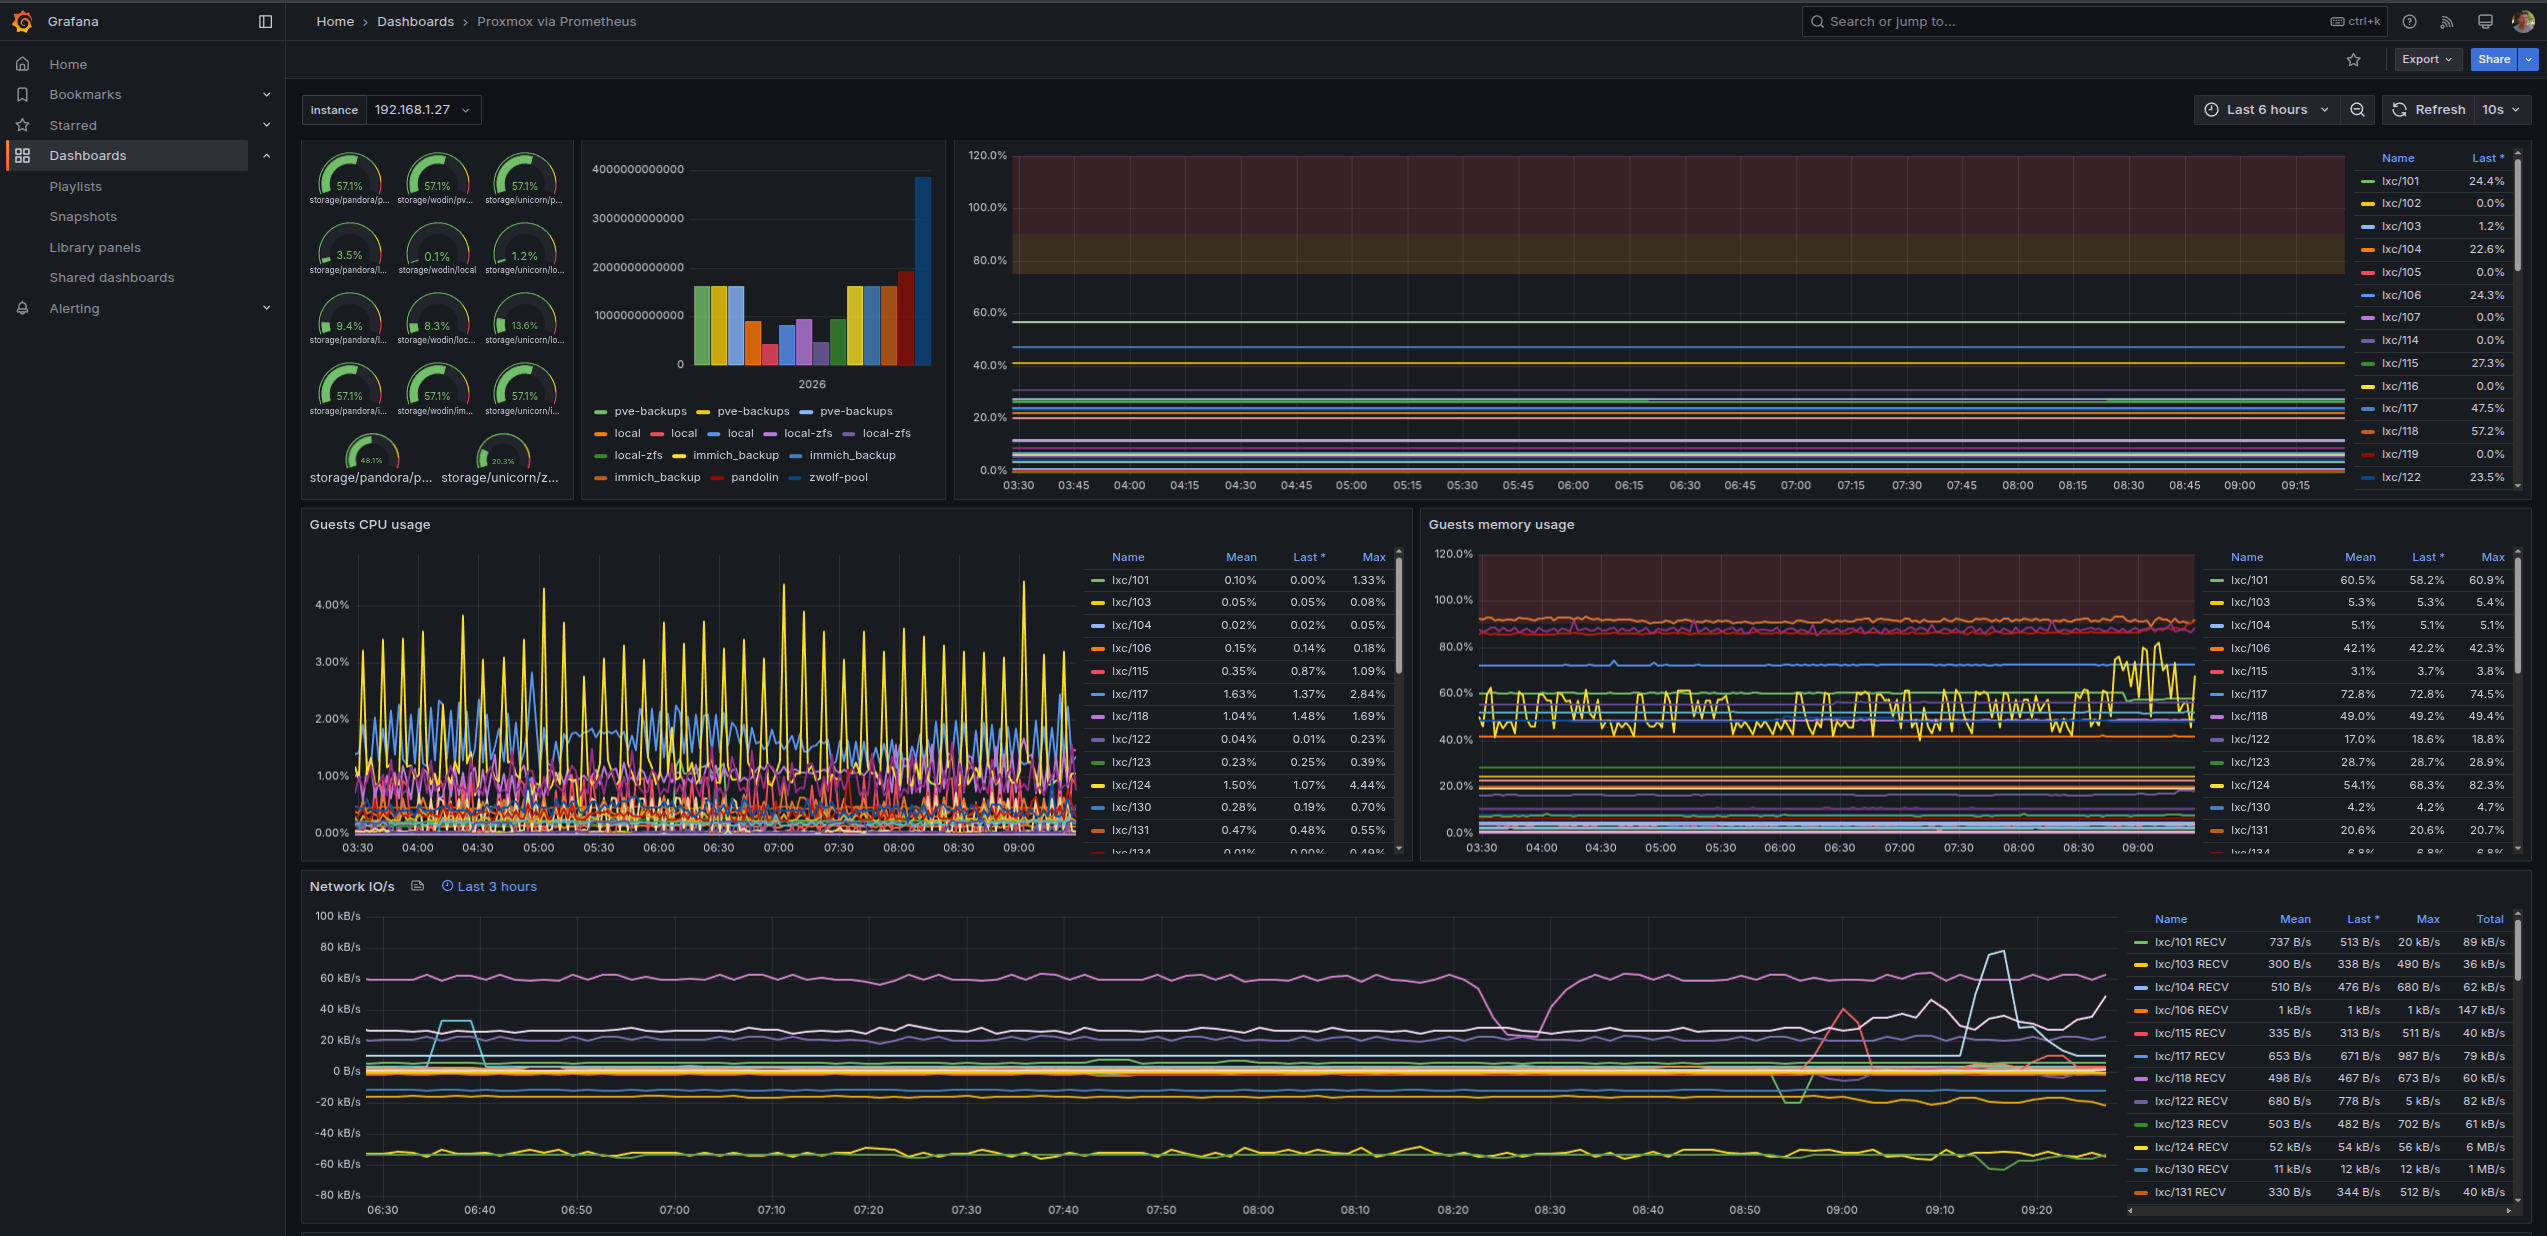
Go to Dashboards → Import and enter dashboard ID 1860 (Node Exporter Full — the community standard). Select your Prometheus data source and click Import. You’ll immediately see CPU, RAM, disk, and network graphs for your host.
⏰ What to Monitor Next
Once the base stack is healthy, the natural next steps are:
- Add Alertmanager to route critical alerts to email or Slack.
- Deploy cAdvisor alongside node-exporter for container-level metrics.
- Add a Blackbox Exporter to probe your public URLs and catch downtime before your clients do.
You’re done! You now have a production-grade observability stack running entirely on your own hardware, no SaaS subscription required.
Give the Node Exporter Full dashboard a scroll and let me know what looks suspicious on your box. There’s always something. Next time we’ll look at writing your first alert rule so Prometheus pages you instead of your clients paging you.
Thanks!